
If you feel like it's harder than ever to turn a profit running a restaurant, you’re not alone. Rising food and labor costs, evolving guest expectations, and insane commissions from third-party tech providers have all contributed to narrower margins. Savvy operators are using a bevy of strategies to stay profitable—from menu engineering to setting up online ordering, reducing hours, spending more on marketing, incorporating QR codes, and streamlining their tech stack—but how do you know which strategy will really move the needle? Customer feedback is great but isn't always reliable. To truly make smarter business decisions, you want to rely on data from your POS reports.
Assuming you have a good POS system, your POS reports can provide a lot more than just sales data. Indeed, your POS system is at the heart of your operations, constantly gathering data. By getting a good handle on how to use reports from your POS system—and restaurant analytics—you'll have the information you need to make better-informed business decisions, grow revenue, and cut costs.
the
What is a POS report?
POS reports are exactly what they sound like—reports that your point-of-sale system creates to give you better insights into your business operations. More than just a way to take orders and payments, today's cloud-based POS systems collect data from dozens of touchpoints. For a restaurant POS system specifically, that can include data analytics on your menu items and modifiers, employee performance, employee clock-ins, sales trends over time, sales by tender, loyalty check-in, and more.
What are restaurant analytics?
While POS reports provide you with POS data in an easy-to-understand format, restaurant analytics is the act of making sense of that data. For example, what do inventory reports tell you about your restaurant? Are you over-ordering, leading to food waste? Are you overspending on an expensive ingredient that's only used in one dish? And what do your sales reports tell you? Your employee reports? Based on those answers, you can then take a no-BS approach to increasing your restaurant's profits.
POS reports and restaurant analytics go hand-in-hand. The best restaurant POS systems will provide you with both clarity and the flexibility you need to customize POS reporting to the way your restaurant operates. Here are 7 of the most insightful POS reports based on feedback from real restaurant operators using SpotOn Restaurant POS.
1. Daily Sales Recap: easy-to-read sales data
This is the go-to report for restaurant operators to monitor the daily health of their restaurants. With a clear view of net sales broken down by category, with details on voids, discounts, batches, and reconciliation, the Daily Sales Recap makes it easy to monitor daily cash flow. Meanwhile, the Top Sellers graph shows you what menu items are selling the best so you know where to dig deeper when it’s time to adjust and refine your menu offerings.
This report is where your shift managers can get into the weeds of restaurant analytics. Once they get a feel for what daily sales should look like for their given shift, they'll be able to quickly diagnose when something is wrong, whether it's a new cook botching up a popular dish (resulting in voids or discounts) or a server having a bad day (resulting in lower sales numbers).
2. Sales Snapshot: comparing sales over different time periods
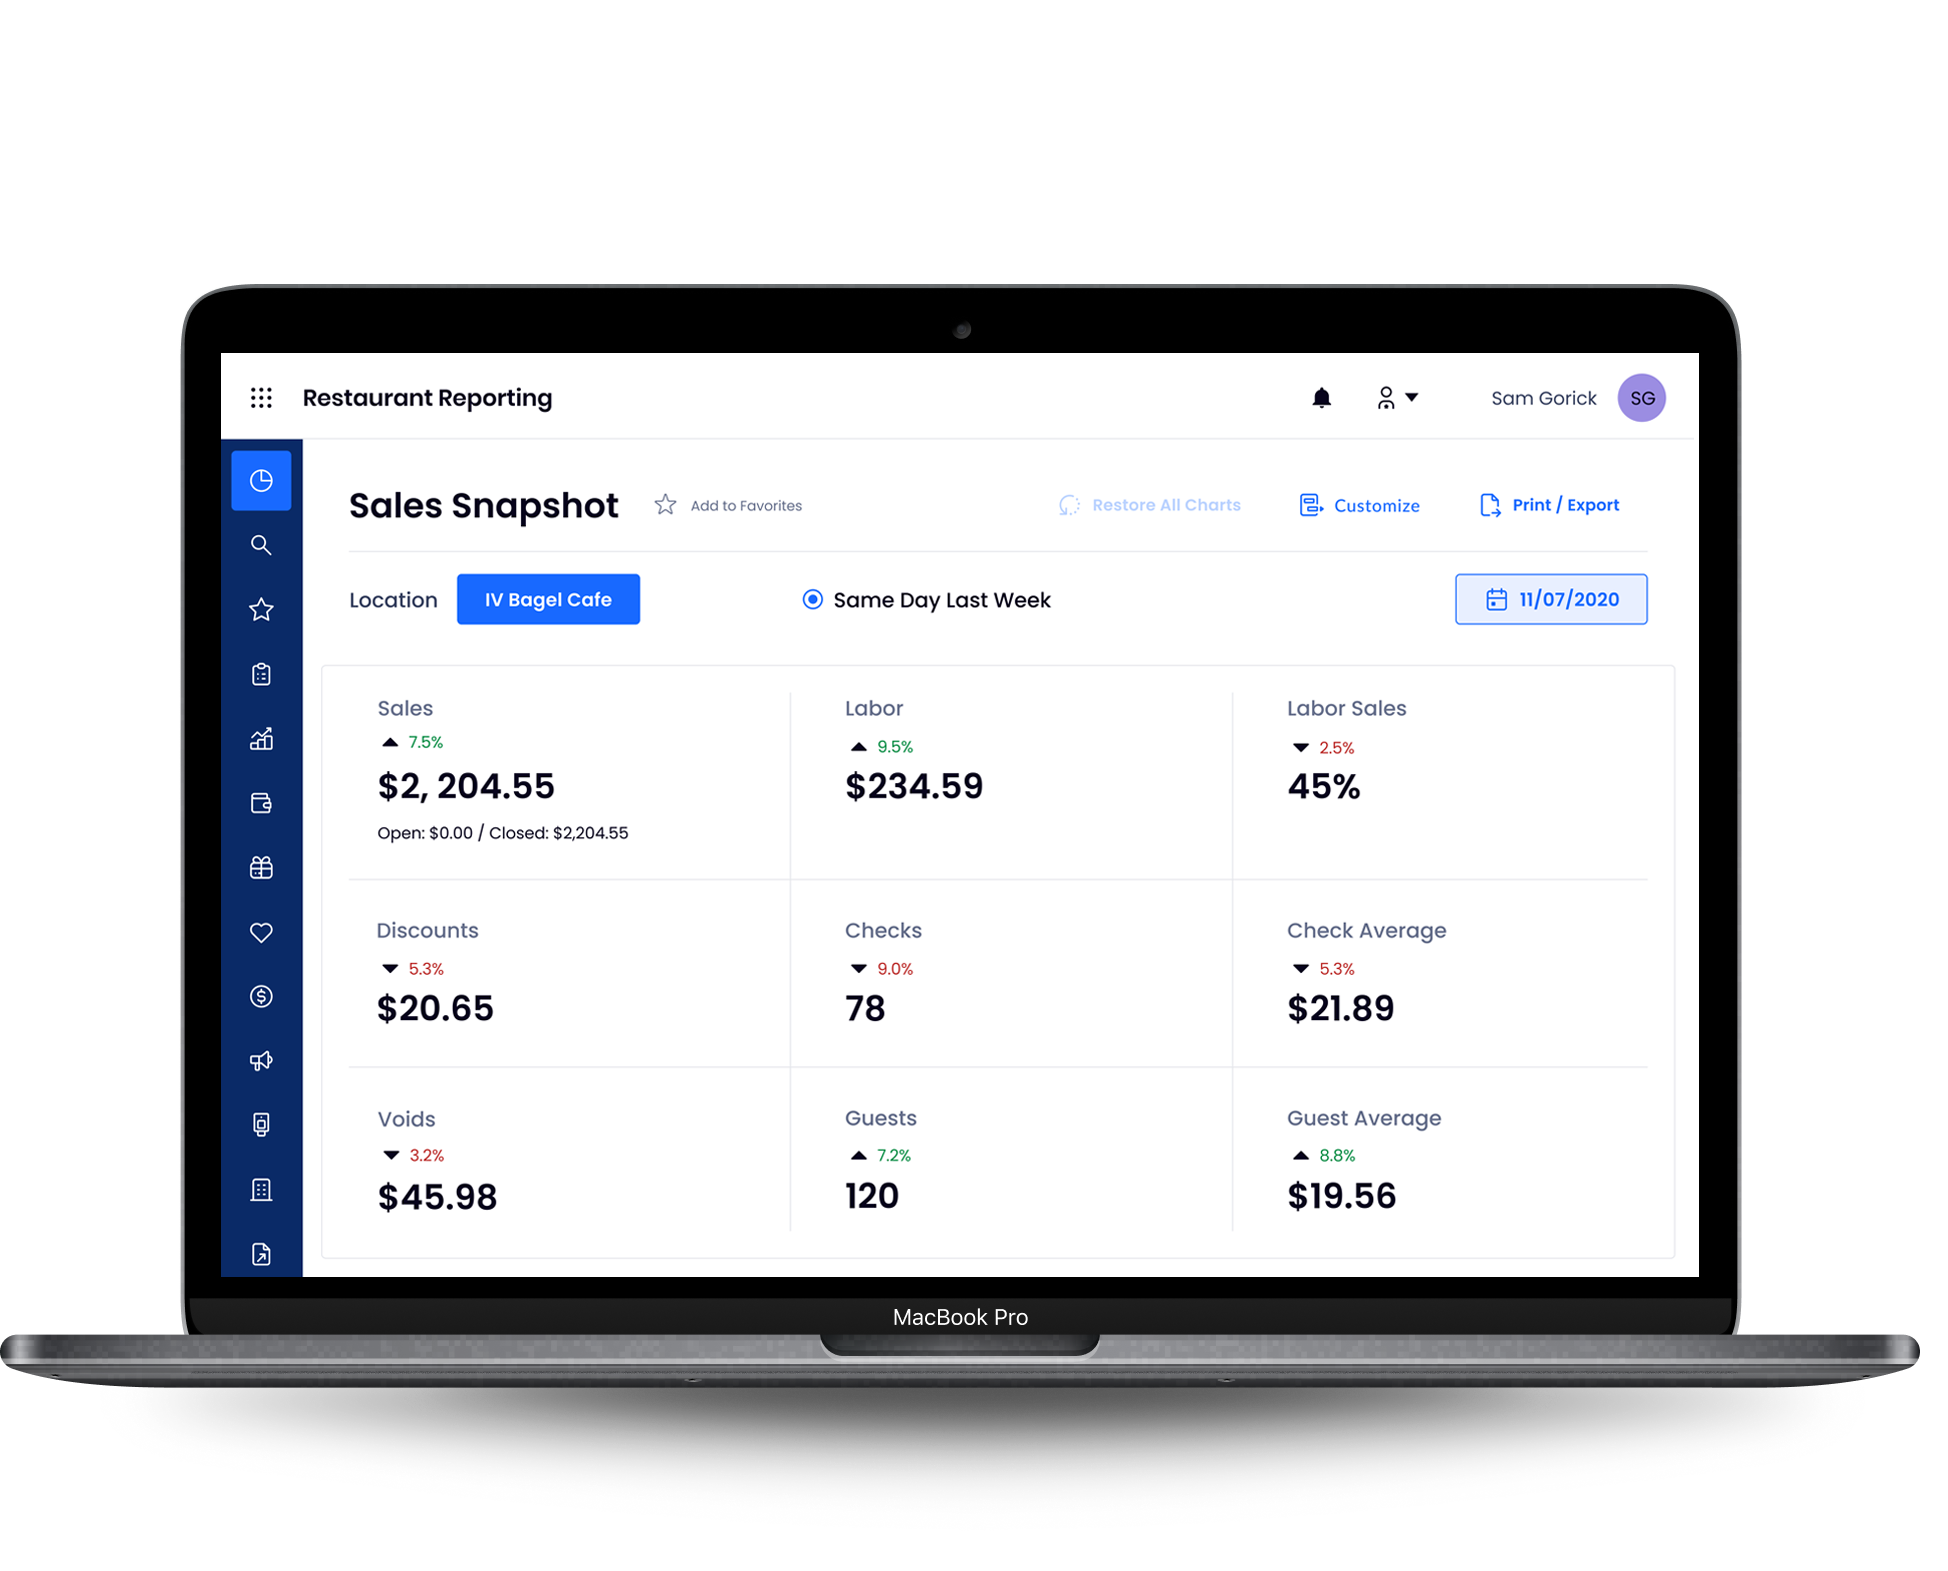
Get the numbers that matter most to understand sales performance at a glance. See sales, labor, discounts, voids, checks, guests, and averages all on one screen. Even better, you can look up any day in the past and see a comparison to the same day in the previous week to get the context behind the numbers. Why is this important? It's not always intuitive to know what normal looks like. Yesterday felt really busy, but how did it compare to the same day last week? What about those pesky holidays or slow days that can easily throw off your weekly numbers? This report makes it easy to find out in moments.
3. Hourly Sales: understanding your day parts
The Hourly Sales report included with SpotOn Restaurant POS makes it easy to see your total sales by hour as well as how many guests and orders are coming through per hour. Run the report for a single day or over a longer date range to fully understand how trends are changing. Filter the data to understand specific sales by hour for your dine-in, carry-out, or online orders and optimize each channel. It’s a great way to figure out your peak hours at a glance and determine when it’s best to schedule your workforce.
Particularly with our competitive labor market, having this data is crucial to ensure you’re not staffing extra people during slow periods. To really take your restaurant analytics to the next level and get a handle on labor costs, you can add restaurant scheduling software that not only saves you time but helps you reduce labor costs by syncing sales information from your POS to make efficient schedules.
4. Product Mix: breaking down your menu
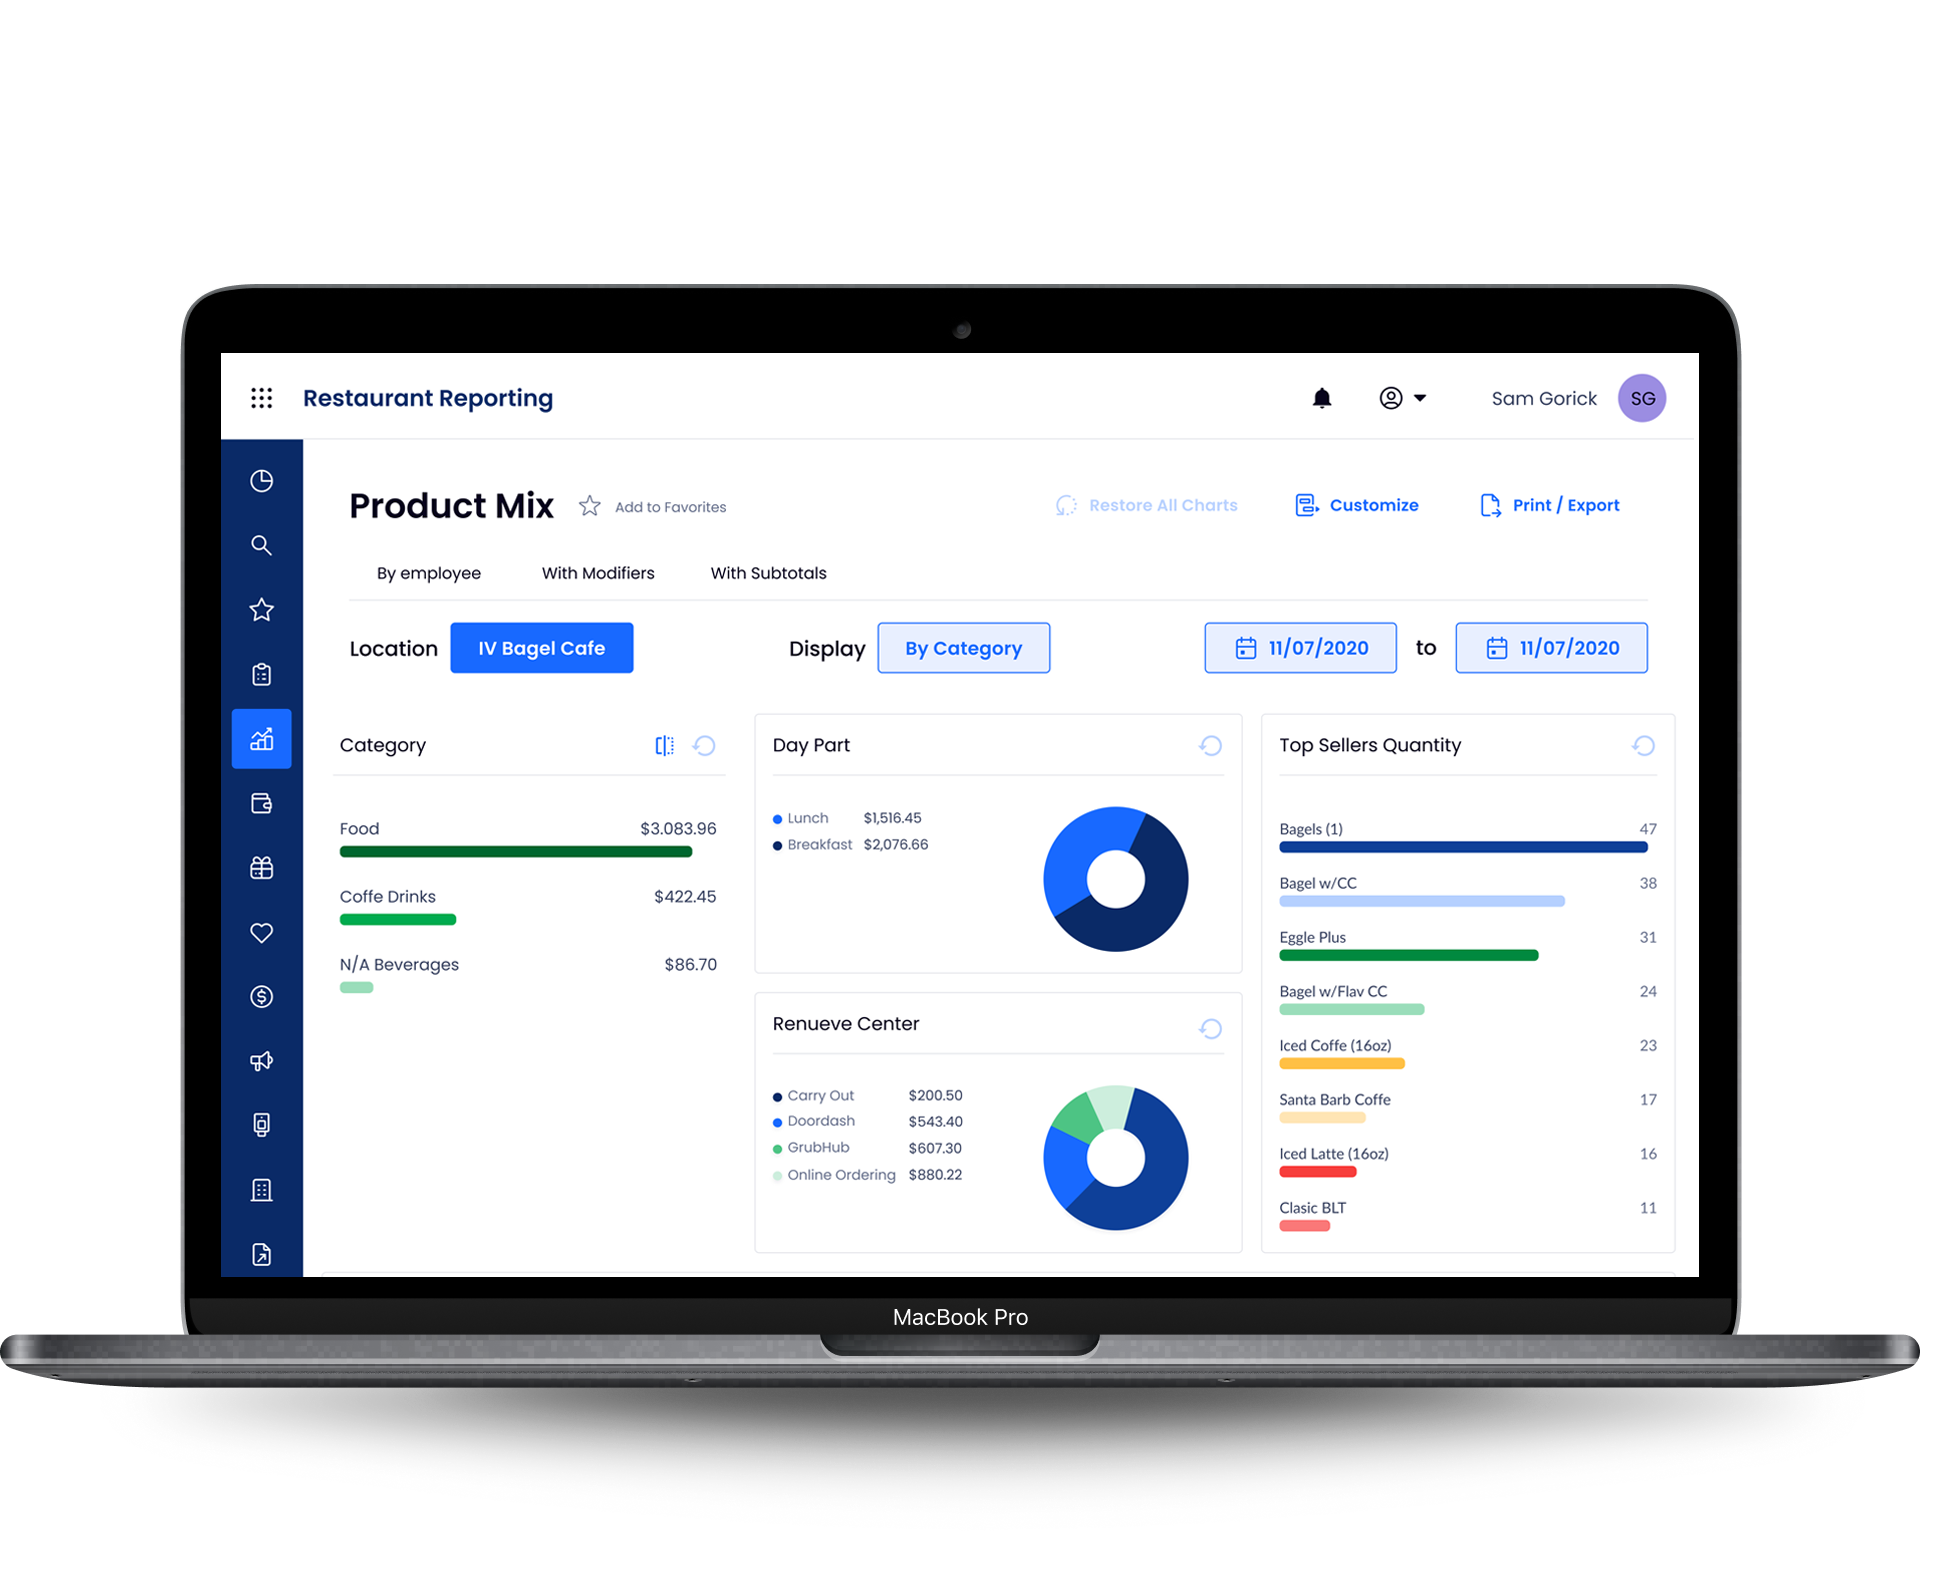
This report gives you all the data you need to sort menu items by parent categories, by day and time, or by top sellers to quickly see what’s selling and what’s not. It’s also fully editable, so you can focus on the data that’s most important to you. If you want to filter the data for your bar manager to only see beverages sold, you can easily do that from this report. Click on any item to get a detailed breakdown of which employees are selling it and which customers are buying it. Most importantly, see which items that product is most often paired with. Looking for a special offer to tempt in more customers during a quieter afternoon period? Look no further—this report gives you the data you need to pick a sure winner.
There are also more specific variations of the Product Mix report:
Product Mix by Employee
Good POS systems not only make it easier for your staff members to do their jobs but also give restaurant managers the POS reporting tools they need to monitor their performance. In addition to various employee and clock-in reports, SpotOn Restaurant has a Product Mix by Employee report that shows you sales performance by employee—with detailed information on the specific menu items each employee is selling. Understand which of your employees are making the most in sales and who is discounting the most. See who your top performers are with certain categories, such as upsell items, and boost sales by scheduling those staff members on Friday and Saturday evenings (or whatever your peak sales times are).
Product Mix with Subtotals
Similar to the standard Product Mix report, this report rolls up items into menu groups and then into categories, giving you an easy way to view reporting on subtotals of each category, such as “sandwiches,” “salads,” “sides,” “desserts,” and so on. Easily understand at a glance the most popular areas on your menu and which areas are most commonly discounted and sold at lower average prices.
Product Mix with Modifiers
If you run a pizza parlor, sandwich shop, or any other type of restaurant with numerous order customization and modification options, the Product Mix with Modifiers report will be your new best friend. This report further divides your product mix into each combination of modifiers that is requested at the time of purchase, giving you the insights you need to determine guest behavior and modify your standardized menu accordingly. It can also help with inventory management. Maybe a lot of people are removing an item from one of your pizzas or requesting additional condiments. With this report, you’ll be able to easily spot those trends, so you can adjust your menu to create a more appetizing and profitable menu.
5. Payroll Report: drilling into labor costs
Labor costs are probably one of your biggest expenses. The Payroll Report helps you keep tabs on exactly what your total payroll costs are on a daily, weekly, and monthly basis. You can drill into individual employees or sort by job position.
To take your restaurant analytics further, sync your POS with a comprehensive labor management solution like SpotOn Teamwork, which leverages sales information from the POS to help you make more efficient schedules and also includes payroll preparation tools to run payroll in seconds rather than minutes...or hours.
6. Credit Card Transactions: follow the money
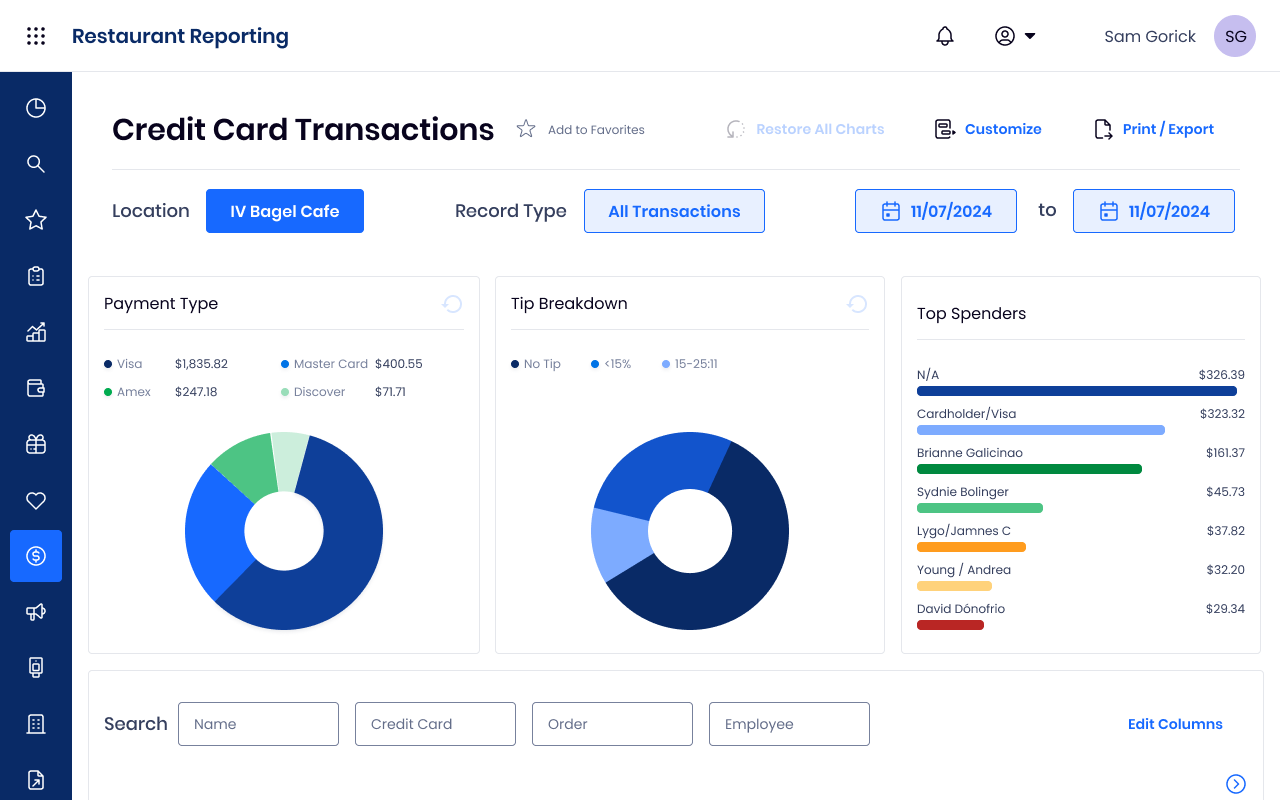
How are your customers paying? How much are they tipping? And who are your top spenders? The Credit Card Transactions report drills into this important customer data with the ability to search and filter by name, card type, order, and employee.
With this information, you can take your restaurant analytics up another notch. Say, for example, your top spenders stick around for dessert and one last drink—boosting overall sales—when paired with a specific server. Not only will you want to ensure that the server is scheduled for that shift, but it may be time to look at promoting that server and having them mentor or train other servers.
7. Deposits Summary: keeping tabs on your cash flow
It's hard to make smart business decisions if you don't know exactly how much revenue you're pulling in on a daily basis. The Deposits summary shows you how much money is getting deposited into your account on a daily basis. See every batch and exactly how much you're paying in processing fees. Then drill in deeper by clicking on Batch Log to see how much each POS station is batching out.
There are a lot of POS systems out there for you to choose from, but at the end of the day, you want to choose the one that works the way you work. Whether you run a single location or multiple locations, intuitive reporting that empowers you to make smart decisions based on real data is going to lead to better profit margins in the long run. Combine that with a tech partner that truly cares about your success, like SpotOn, and you've got yourself more than just a POS—you've got a powerful data-capturing tool and a 24/7/365 team of experts behind you.