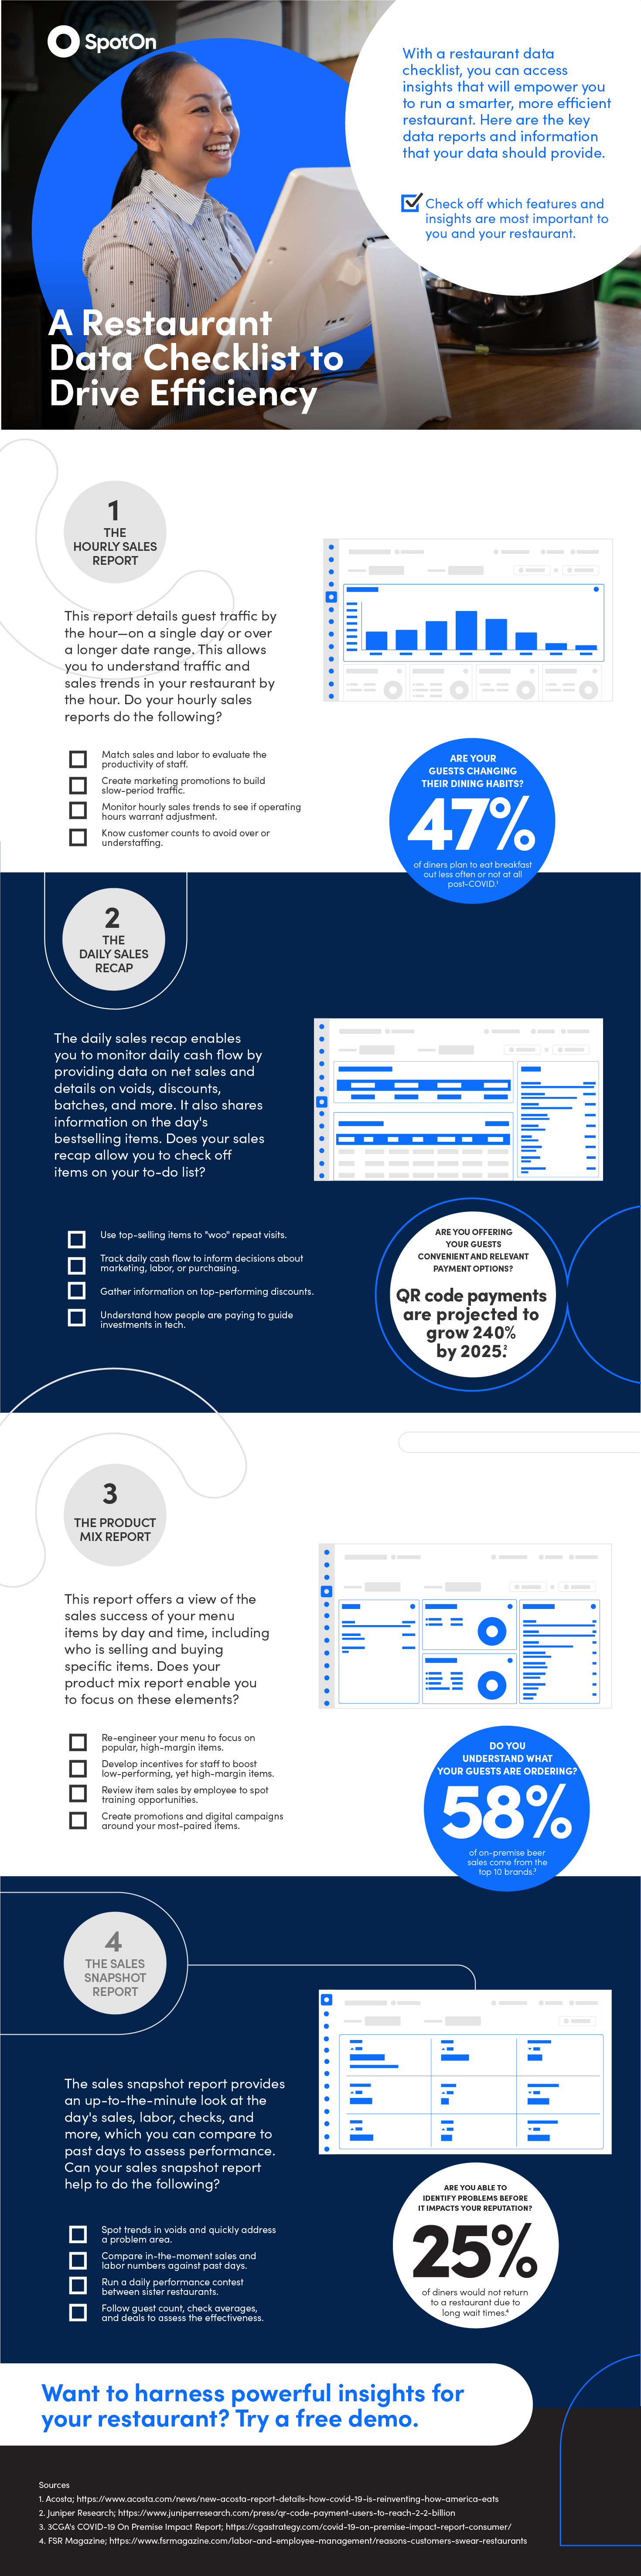
With a restaurant data checklist, you can access insights that will empower you to run a smarter, more efficient restaurant. Here are the key restaurant data reports and information that your data should provide.
*Check off which features and insights are most important to you and your restaurant.

Grow your business with SpotOn.
1. The hourly sales report.
This report details guest traffic by the hour—on a single day or over a longer date range. This allows you to understand traffic and sales trends in your restaurant by the hour. Do your hourly sales reports do the following?
- Match sales and labor to evaluate the productivity of staff.
- Create marketing promotions to build slow period traffic.
- Monitor hourly sales trends to see if operating hours warrant adjustment.
- Know customer counts to avoid over or understaffing.
Are your guests changing their dining habits? 47% of diners plan to eat breakfast out less often or not at all post-COVID.1
2. The daily sales recap.
The daily sales recap enables you to monitor daily cash flow by providing data on net sales and details on voids, discounts, batches, and more. It also shares information on the day’s bestselling items. Does your sales recap allow you to check off items on your to-do list?
- Use top-selling items to “woo” repeat visits.
- Track daily cash flow to inform decisions about marketing, labor, or purchasing.
- Gather information on top-performing discounts.
- Understand how people are paying to guide investment in tech.
Are you offering your guests convenient and relevant payment options? QR code payments are projected to grow 240% by 2025.2
3. The product mix report.
This report offers a view of the sales success of your menu items by day and time, including who is selling and buying specific items. Does your product mix report enable you to focus on these elements?
- Re-engineer your menu to focus on popular, high-margin items.
- Develop incentives for staff to boost low-performing, yet high-margin items.
- Review item sales by employee to spot training opportunities.
- Create promotions and digital campaigns around your most-paired items.
Do you understand what your guests are ordering? 58% of on-premise beer sales come from the top 10 brands.3
4. The sales snapshot report.
The sales snapshot report provides an up-to-the-minute look at the day’s sales, labor, checks, and more, which you can compare to past days to assess performance. Can your sales snapshot report help to do the following?
- Spot trends in voids and quickly address a problem area.
- Compare in-the-moment sales and labor numbers against past days.
- Run a daily performance contest between sister restaurants.
- Follow guest count, check averages, and deals to assess the effectiveness.
Sources:
- Acosta; https://acosta.com/news/new-acosta-report-details-how-covid-19-is-reinventing-how-america-eats
- Juniper Research; https://www.juniperresearch.com/press/qr-code-payment-users-to-reach-2-2-billion
- 3CGA’s COVID-19 On Premise Impact Report; https://cgastrategy.com/covid-19-on-premise-impact-report-consumer/
- FSR Magazine; https://www.fsrmagazine.com/labor-and-employee-management/reasons-customers-swear-restaurants