
The 2026 World Cup brought a lot of headlines about billions in economic impact and packed hotels in host cities. Less has been said about what happened inside the restaurants a few blocks from the stadiums and fan zones, the ones that didn't have a sponsorship deal or a huge marketing budget. We pulled SpotOn point-of-sale data from Atlanta, Boston, Dallas, Houston, Kansas City, Los Angeles, Philadelphia, the San Francisco Bay Area, and Seattle to find out the true impact the World Cup had on independent restaurants.
Match days were good for business
Broader economic reporting on the tournament found host cities saw overall card spending rise 6.3% year over year, driven largely by a 16.7% jump in spending from visitors from out of town, according to a Forbes analysis of the early tournament window. Restaurants captured a meaningful share of that.
SpotOn found that independent restaurants in the nine host metros saw orders jump 40.6% and average checks climb 25.4% on match days compared to non-match days, and the same held up throughout the full tournament, from group stage through the final. That's roughly five and a half weeks of consistent gains, not a hot opening weekend, and it lines up with a CNBC report that found the tournament gave bars and restaurants a needed boost even as broader consumer spending showed signs of strain.
Here's what the numbers show, and what they mean for owners and operators thinking about the next big event on the calendar.
Fans filled the dining room, not the delivery queue
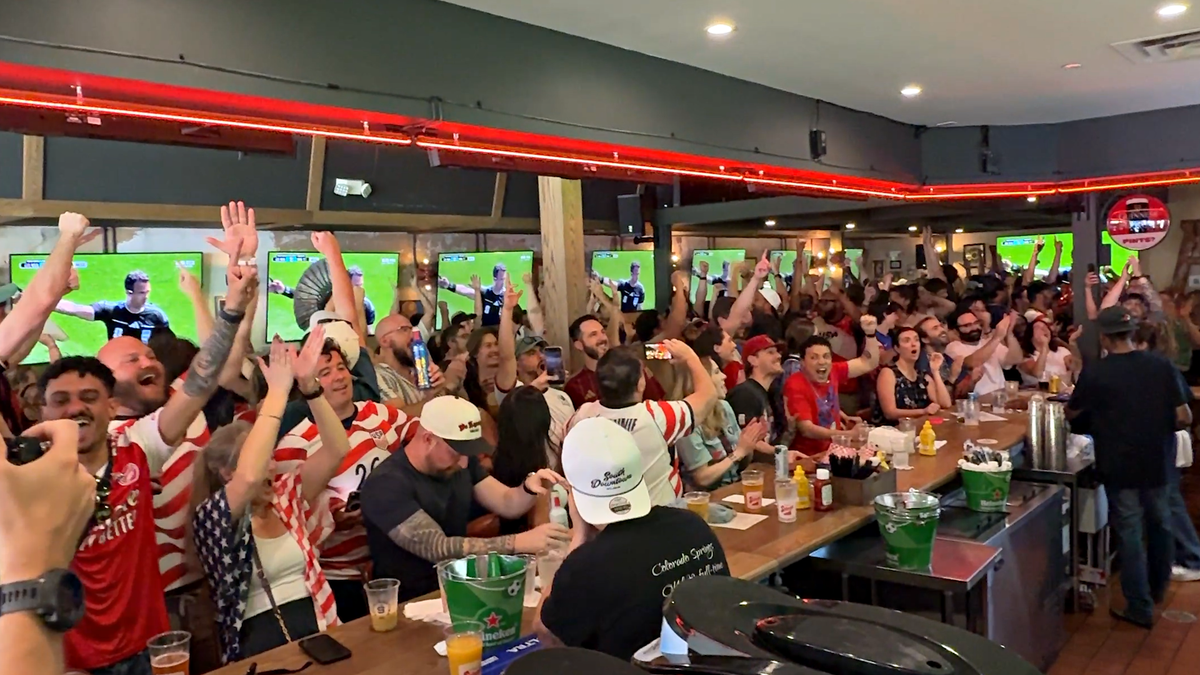
The assumption with sports viewing is usually delivery. More people watching from home, more apps open, more bags on porches. SpotOn data says the opposite happened for restaurants in these nine host cities during the World Cup.
Dine-in orders rose 11.1% and takeout rose 13.2% on match days, while phone orders fell 31.8%, catering fell 25.7%, and third-party delivery dipped a more modest 7.0%. Fans wanted to watch together, in a room with a crowd and a big screen.

That's a useful data point for any operator deciding how to plan and staff for future sporting events, from game day promotions to watch parties. The data suggests people showed up for the experience, as well as the food and drink. It also points to why a restaurant management system that helps a restaurant handle a full house matters as much as the menu does during cultural moments like these.
Tipping went up faster than spending did
This is the number that stood out most to us. Tip percentage rose from 6.80% to 8.93% on match days, a 31.3% jump, outpacing even the 25.4% rise in average check. If tips were only rising because checks were bigger, you'd expect the two numbers to move together. Tips rising faster says guests were in a better mood, and it showed in how they treated the people serving them.
Restaurant tipping has taken a beating for two years running, with plenty of coverage on tipping fatigue and declining generosity. A high-energy, communal occasion moved that number in the other direction. Hospitality still runs on the guest experience as much as the bill.
Not every host city cashed in the same way
A national number flattens out a lot of local reality, and this tournament had plenty of it. Looking at average check lift against each city's own baseline over the full tournament: Philadelphia led with a 28% lift, followed by Boston at 15%, and Los Angeles at 13%. Atlanta came in at 6.3%, Kansas City was roughly flat, and Seattle and the Bay Area each saw modest pullbacks. Houston posted a 12% decline. Dallas stood out at the other extreme, down roughly 40% against its own baseline, and that gap held for the entire tournament rather than fading after the group stage.
"Match days were actually slow for us, and we heard the same from other restaurants in the neighborhood," said Marie-Lou Nahhas, Beirut Taco in Kansas City. "A lot of that traffic went to the FIFA Fan Fest here in Kansas City, where fans could watch the games together."

Kansas City's restaurants saw only a modest, roughly flat lift in average check size on match days (well below cities like Philadelphia and Boston) suggesting proximity to an official fan zone may have pulled some demand away from nearby independent restaurants, even in a host city.
While we don't fully yet know why some cities underperformed, kickoff timing, distance from watch-party hubs, and local team fandom are all reasonable starting points. All aspects that will be worth watching as operators plan for the next event of this scale, including Los Angeles, which hosts the Super Bowl in 2027 and the Summer Olympics in 2028.
Some of the gain likely came from next door, not from nowhere
Non-host cities saw average checks dip about 6.2% versus their own baseline on match days. While modest, it's consistent and it suggests some of the host-city lift reflects attention and spending shifting locally toward the event rather than the World Cup creating entirely new demand everywhere. Not every restaurant in the country got a World Cup bump. The ones near the action did, and that lines up with broader coverage asking whether the World Cup was worth it for the country overall, even as it delivered a reported $20 billion boost to the US economy.
What this means for operators planning around the next big event

The tournament is over, but the next demand spike is always around the corner: the start of football, basketball, and hockey seasons, a World Series run, a festival weekend. Local restaurants and bars have seen similar spikes tied to championship runs before. Toronto restaurants and bars saw a comparable burst of foot traffic and spending during the Blue Jays' 2025 World Series run.
Extended hours and extra staffing on high-demand nights paid off in this data, and a restaurant management system with real-time reporting is what lets an operator see that lift happening as it's happening, not weeks later in a spreadsheet. SpotOn's reporting tools give owners same-day visibility into order volume, order type, and tip trends so they can staff and plan with real information instead of a guess.
Order type mix matters as much as total volume. If a big local event is coming and a restaurant runs on delivery apps alone, this data is a nudge to think about the dine-in experience, too. A POS platform that tracks order channels at the transaction level, the way SpotOn's point-of-sale does, is what makes a finding like this visible in the first place.
If a global tournament can lift sales this clearly for independent restaurants, in cities on both ends of the spending spectrum, local leaders and restaurant operators have real data to plan around. We'll be watching how this plays out for the next major U.S. event and ready to help restaurant owners and operators on their path to profitability.